
Belgium: Belgium Nature protection and biodiversity
2011/07/03
Why Belgium cares about biodiversity and the status of the loss of biodiversity.
Key message
Biodiversity in Belgium is under tremendous pressure and could have an impact on human health and the productivity of the rural areas.
Biodiversity in Belgium is under tremendous pressure as a result of human activities. This pressure is especially high to the north of the Sambre and Meuse rivers, where the human population density is exceptionally high. Besides eutrophication, acidification, climate change and invasive alien species, land conversion poses a big threat to biodiversity. Construction and densification of the transport infrastructure are the main drivers behind the increased fragmentation of the natural spaces. Due to this fragmentation, species that are unable to adapt to climate change are also incapable of moving to a more suitable habitat through natural dispersion. It is feared that as individual species start disappearing, the quality of larger parts of the ecosystem will decline. This could have impacts on human health and well-being and the agricultural productivity of rural areas in Belgium, even though considerable uncertainties on the topic remain.
The state and impacts
The state of and the impact on biodiversity in Belgium.
The state of biodiversity in Belgium is described with indicators on species abundance and detailed with figures on the conservation status of species of European interest for the national (where available) as well as the regional levels. Trends are given for some bird indices (e.g. the European common bird index). The state of biodiversity is always closely connected to the quality and availability of habitat, hence the inclusion of several descriptive figures on the progress of their conservation to conclude the section.
The status and trends in species in Belgium.
Key message
A great number of species in Belgium are critically endangered especially amongst the reptiles, amphibians and butterflies.
Regarding terrestrial biodiversity, a great percentage of reptiles (71 %), amphibians (60 %) and butterflies (60 %) are currently 'critically endangered'1. For mammals (36 %), birds (25 %), fish (23 %) and vascular plants (29 %), the situation is slightly better. More worrying is the situation for dragonflies and damselflies where 48 % of the species analysed are critically endangered. Terrestrial biodiversity in Belgium is monitored and managed on a regional level. More precise data are therefore given below per region.
Concerning marine environment, there has been a continuous decline in the number of fish species and crustaceans in the Belgian part of the North Sea, primarily as a result of overfishing2.
The trend of the marine bird species occurring in the Belgian part of the North Sea and listed in annex I of the EU Birds Directive is as follows: the populations of little tern (Sterna minor) is in decline while the populations of Sandwich tern (Sterna sandvicensis) and common tern (Sterna hirundo) are stable or fluctuating3. Several reports describe the international importance of the Belgian part of the North Sea for marine bird species.
The trend for marine mammals is less clear, although it is certain that most species remain threatened. Article 17 reporting, in application of the Habitats Directive, mentions positive trends for the harbour porpoise (Phocoena phocoena) (primarily due to a shift of the population in the North Sea), the common seal (Phoca vitulina) and the grey seal (Halichoerus grypus)4.
The status and trends in species in the Flemish Region
Key message
The conservation status of only a small percentage of the species occurring in the Flemish Region has been documented. From what we know the situation is especially worrying for butterflies where more than 50% of the species documented are on the Flemish Red List.
Figures
Figure 1. Species status in the Flemish Region in 2008
Figure 1 illustrates the species status in the Flemish Region. The conservation status of 3 451 of the species (9 % of the total) occurring in Flanders has currently been documented. Knowledge on the status of Flemish biodiversity is strongly biased toward vertebrates and vascular plants. From the species assessed, 6 % have recently become regionally extinct and 29 % have been listed as 'critically endangered', 'endangered' or 'vulnerable' so-called Red List species. Butterflies are among the most affected with 25 % extinct and 33 % on the Flemish Red List. Empidids (no extinctions and 15 % on the Red List) and Dolichopodids (9 % extinct and 18 % on the Flemish Red List) prove to be the most robust species groups.
The status of habitat conservation in the Flemish Region
The status and trends in species in the Walloon Region
Key message
In Wallonia, the species conservation status is poor for roughly 40% of the species which were monitored.
The status and trends in species in the Brussels-Capital Region
The status of habitat conservation in the Walloon Region
The status of habitat conservation in the Brussels-Capital Region
Abundance and distribution of selected species in the Flemish Region
Figure 2. Trend abundance of forest, farmland and other common birds in the Flemish Region (1990 to 2007-2008)
Figure 2 illustrates the evolution of the European Common Bird Index from 1990 to 2007-2008 in Flanders. The ‘Common bird index’ is calculated as the trend abundance of forest, farmland and other common birds. The trend is calculated as annual median over species.
The farmland bird indicator dropped sharply between 1990 and 2000-2002. Afterwards, the decline continued, but less pronounced.
Abundance and distribution of selected species in the Walloon Region
Key message
Near one third of the nesting bird species in the Walloon Region are threatened and the abundance of the forest common birds and farmland birds is declining.
The conservation status of 'species of European interest' in the Flemish Region
Key message
In the Flemish Region, slightly more than a quarter of the species (16 species, 27 %) have a favourable conservation status. For 12 species (20 %) the conservation status is inadequate and for 22 species (37 %) the status is unfavourable (bad).
The status of habitat conservation in Belgium
Key message
The conservation status of 79% of the habitat which is to be conserved in the framework of the EU Habitat Directive in Belgium has an 'unfavourable bad' conservation status.
Figure 6. Overall assessment of conservation status by habitat category (%) (2001-2006).
he overall assessment of conservation status as reported within the framework of the Article 17 reporting of the EU Habitats Directive (2001-2006) is the following: 6 % of the Belgian habitats are in ‘favourable’ conservation status; 13 % are in ‘unfavourable inadequate’, 79 % ‘unfavourable bad’ and 2 % are in ‘unknown’ status. Figure 5 shows the assessment of conservation status by habitat category.
The key drivers and pressures
The related key drivers and pressures on nature protection and biodiversity in Belgium
Key message
Land conversion, fragmentation, artificialisation, eutrophication, acidification, climate change and invasive alien species are the most prominent drivers behind the loss of biodiversity in Belgium.
Land conversion, fragmentation and artificialisation - whether for urban and industrial expansion, agriculture, infrastructure or tourism - are among the major causes of biodiversity loss in Belgium. This topic is treated elsewhere, under commonality topic land use.
Other key drivers and pressures such as eutrophication, acidification, climate change and invasive alien species are discussed in this section with regional indicators and figures on the subject. Additionally, high recreation pressure – especially in the Brussels-Capital Region - is also an important driver of biodiversity loss in Belgium, but is not discussed in the current analysis.
Exceedance of critical load for eutrophication in the Flemish Region
Key message
The exceedance of the critical load for eutrophication in Flanders is one of the highest in Europe.
- Data source
- http://indicatoren.milieuinfo.be/indicatorenportal.cgi?lang=en&detail=57
Figure 8: Exceedance of critical load for eutrophication in Flanders 1990-2006
Atmospheric deposition of nitrogen in Flanders amounted to an average of 37.0 kg N/ha in 2006, a reduction of 33 % compared to 1990. In 2006, nitrogen deposition exceeded the critical load in 100 % of forest, 100 % of heathland and 68 % of species rich grassland areas. Together, this amounts to 91 % of the nitrogen sensitive areas. The exceedance in 2006 averaged 17.6 kg N/ha. The mean exceedance is highest in forests (+23.4 kg N/ha in 2006), followed by heathlands and species-rich grasslands (+13.4 and +5.8 kg N/ha respectively in 2006). The exceedance of the critical loads in Flanders is one of the highest in Europe (European Environment Agency, 2005). The average exceedance of the critical load has been decreasing since 1999 (trend 2000-2006: -1.7 kg N/ha/year).
Exceedance of critical load for acidification in the Flemish Region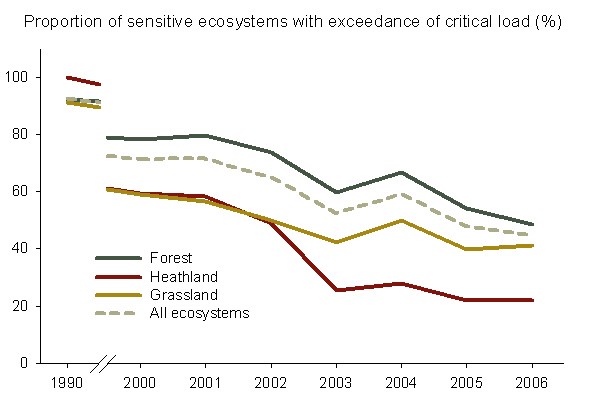
Exceedance of critical load for eutrophication of forest and semi-natural ecosystems in the Walloon Region

- Related Articles
-
Belgium Foreign Relations Profile
2012/05/13 Belgium Foreign Relations Profile -
Belgium Business Forecast
2012/05/13 更多 -
IMF Data & Forecasts
2011/08/10 2010 2015 Scale Units GDP at constant prices 331.37 359.99 Billions -
Belgium Pesticides and Biocides
2011/07/03 National and regional story (Belgium) - Reduction of the use of pesticides and biocides Environmental programme on pesticides at the Belgian federal level+ Key message A programme for the Reduction of Pesticides and Biocides (PRPB) was developed at Belgian federal level -
Belgium Transport flows and Transport infrastructure
2011/07/03 Urbanisation and transport in the Flemish Region of Belgium Key message Flanders is an urbanised region with an extensive transport infrastructure. ’Flanders in Action’ is the main Flemish policy plan looking forward to 2020.
-
- Belgium News
-
- AFGHANISTAN: UNWTO: International tourism – strongest half-year results since 2010
- ALBANIA: US LNG exports make European market more competitive
- BELGIUM: Belgium Consumer Confidence Unchanged In August
- BELGIUM: Brussels Tourism launches its first Urban Culture Guide
- AFGHANISTAN: Higher earning Why a university degree is worth more in some countries than others
- BELGIUM: Belgium green lights unchanged Ceta

- Trending Articles
-
- EUROPE: Ball Corporation Debuts Three New Aluminium Beverage Can Sizes
- SOUTH AFRICA: Nigeria and South Africa emerge from recession
- NIGERIA: The Security and Exchange Commission approves the 40th Annual General Meeting of Oando PLC
- CHINA: Xi Jinping opens BRICS Summit in Xiamen, asks members to shelve differences
- BAHRAIN: Aluminium Bahrain’s Line 6 Expansion Achieves 25 Percent Completion
- CHINA: Chinese-supported infrastructure projects change Zambia's landscape


