


Brunei : Brunei Economy Profile
2015/02/16

BASIC INFORMATION
Capital: Bandar Seri Begawan
Surface Area: 5,765 sq km
Head of State: His Majesty Sultan Haji Hassanal Bolkiah Mu’izzaddin Waddaulah
Official Language: Malay
Currency: Brunei Dollar (BND)
Population: 417,800 (2013 estimate)
GROSS DOMESTIC PRODUCT (GDP)
Brunei had a negative GDP growth of 1.8% in 2013, mainly due to decreased exports of oil and gas. As the economy is dominated by the oil and gas sector, it is highly vulnerable to changes in production and international prices. Brunei’s GDP in 2013 was US$ 16.11 billion and in 2013 Brunei had ASEAN’s second highest GDP per capita of US$38,563.


Household consumption accounted for about 23% of Brunei’s GDP in 2013, or US$3.66 billion. Government consumption totalled US$2.95 billion, about 18% of GDP, while investment amounted to US$2.47 billion and accounted for 15% of GDP. Brunei has a trade driven economy, and external balance accounted for about 50% of GDP in the period 2010-2012, but decreased to 44% in 2013, with just over US$7 billion in external trade balance.

Source: The World Bank
GDP Composition
The services sector accounted for nearly a third of Brunei’s GDP in 2013, while manufacturing accounted for about 12% and agriculture, including forestry and fishing, only 1% of GDP. Other industries, besides manufacturing, account for about 56% of Brunei’s GDP. In 2012, when other industries accounted for 59%, of which oil rents contributed 25.1% and natural gas rents 10.8%.

Source: The World Bank
CURRENCY
The Brunei Dollar has the currency code BND, and is abbreviated with B$. It is divided into 100 cents. The average bid rate for the first three quarters of 2014 was 1.24012 BND per US Dollar and the average ask rate for the same period was 1.27532.
Official Exchange Rate
BND per USD – 1 year

The Brunei dollar appreciated against the US dollar during the period between mid-year 2010 and mid-year 2011. After a slight depreciation in late 2011, the Brunei dollar has been stable around 1.24 BND per USD.

![]()
FOREIGN TRADE
Intra- and extra-ASEAN trade in 2013
Brunei’s total goods trade with the world reached US$15.06 billion in 2013, with a total of US$11.44 billion in goods export in 2013, while importing US$3.61 billion; hence, achieving a positive trade balance of US$7.83 billion. Brunei has been able to maintain a positive trade balance since 2000 due to its booming export engine – oil and gas.

Intra-ASEAN trade reached US$4.48 billion in 2013, accounting for 29.7% of Brunei’s total trade. The share of intra-ASEAN exports of total exports was 23.1% and the share of intra-ASEAN imports of total imports was 51% in 2013.
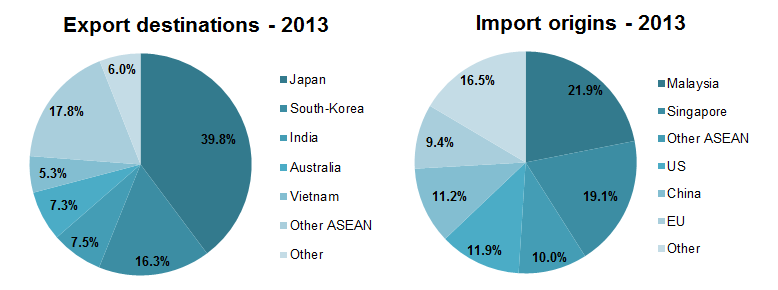
Brunei’s intra- and extra- ASEAN exports and imports, 2013

Trade partners
About a half of Brunei’s imports are from ASEAN countries, mostly from Malaysia (21.9%) and Singapore (19.1%). Other large import partners include the US (11.9%), China (11.2%), and the EU (9.4%), while about 16.5% of imports are from other sources. The energy-hungry Japan and South-Korea are Brunei’s largest export destinations, with almost 40% of all Brunei exports destined for Japan and more than 16% destined for South-Korea in 2013. About 23% of exports in 2013 went to ASEAN countries while India received 7.5% and Australia 7.3%.
Source: The World Trade Organisation
Commodity groups
Unlike most of its ASEAN neighbours, Brunei does not possess vast lands to carry out large scale agricultural farming or industrial manufacturing. Fuels and mining products dominate Brunei’s exports with over 90% of total exports in 2013, while only 3.9% of exports were manufactured goods and only a negligible 0.1% of exports were agricultural products. About 72.5% of Brunei’s imports are manufactures, while 11.3% are fuels and mining products and 14.2% are agricultural products.

Source: The World Trade Organisation
Intra- and extra-ASEAN trade 2005-2013
Brunei’s trade with the world has seen a steady upwards trend, despite a significant decrease in 2009 following the global financial crisis as well as a smaller decrease in 2013 compared with the year before. Over the period 2005-2012, Brunei’s total trade has grown 12% annually.
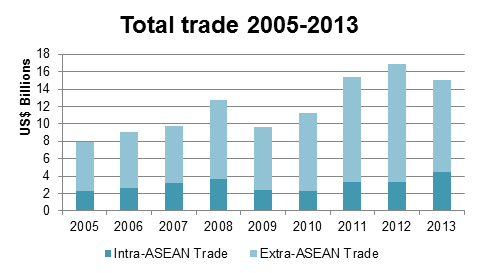
Extra-ASEAN trade had grown faster than intra-ASEAN trade over the past few years but the contrary was true in 2013 when intra-ASEAN trade was US$1.15 billion higher than the year before compared with extra-ASEAN trade which was US$2.95 billion lower than in 2012. The share of intra-ASEAN trade has therefore risen from 20% of total trade in 2012 to 30% in 2013.
Intra-, extra- and total trade 2005-2013 (US$ billions)

Source: ASEAN Statistics
Trade in services 2005-2011
Brunei’s total trade in services in 2011 (latest available data) totalled US$3.02 billion, of which the value of exported services was US$1.2 billion while the value of imported services was US$1.82 billion. Brunei therefore recorded a trade deficit in terms of services in 2011 of about US$620 million. While Brunei’s export of services has grown faster than its imports of services for the past few years, Brunei has had a negative trade of services balance over the period 2005-2011.

Trade in services 2005-2011 (US$ billions)

Source: ASEAN Statistics

FOREIGN DIRECT INVESTMENT (FDI)
Brunei’s total FDI net-inflow in 2013 was US908.4 million, of which intra-ASEAN FDI recorded a net outflow of US$72.6 million and extra-ASEAN net FDI inflow reached a US$981 million.
In 2011, Brunei recorded a total of US$1.2 billion in Foreign Direct Investment (FDI) net inflow, the most that the country has ever received. Oil and gas sector remains Brunei’s hottest investment among investors since the country is rich with oil and gas.

FDI net inflows 2005-2013 (US$ millions)

Brunei receives most of its FDI outside of ASEAN, spelling the needs for more collaborations and joint ventures between ASEAN members in the future.
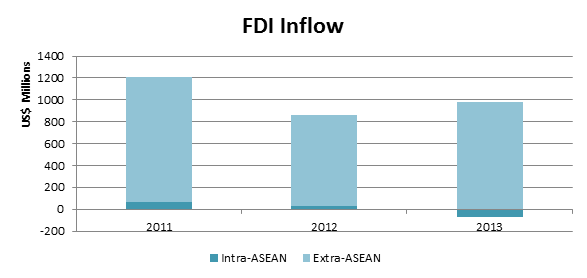
FDI net inflow, intra- and extra-ASEAN, 2011-2013 (US$ millions)

Source: ASEAN Secretariat

- Brunei News
-
- AFGHANISTAN: UNWTO: International tourism – strongest half-year results since 2010
- BRUNEI : The next chapter for the Trans-Pacific Partnership
- AFGHANISTAN: Higher earning Why a university degree is worth more in some countries than others
- AFGHANISTAN: Global growth will be disappointing in 2016: IMF's Lagarde
- BRUNEI : Brunei Darussalam eyes Pacific trade benefits
- BRUNEI : Brunei Darussalam looks to work around LNG challenges

- Trending Articles
-
- SOUTH AFRICA: Nigeria and South Africa emerge from recession
- EUROPE: Ball Corporation Debuts Three New Aluminium Beverage Can Sizes
- BAHRAIN: Aluminium Bahrain’s Line 6 Expansion Achieves 25 Percent Completion
- CHINA: Chinese-supported infrastructure projects change Zambia's landscape
- NIGERIA: The Security and Exchange Commission approves the 40th Annual General Meeting of Oando PLC
- UZBEKISTAN: Former deputy PM named Uzbekistan Airways head


